Observability
In the previous document you deployed your Spring Boot applications to a VPS with Coolify. Now that the apps are running in production, you need to know what they are actually doing—without adding print statements and redeploying. Observability is about understanding your application in production: tracing requests across services, seeing error logs in context, and understanding performance bottlenecks without guessing.
How instrumentation works
The process breaks down into three logical steps:
-
Data Collection (The Application): You modify the app to include specialized code that collects various kinds of data about the app's internal state and the host server environment.
-
Data Storage (The Telemetry Backends): The collected data ships out of the application process and goes to corresponding, optimized telemetry backends, which are databases designed specifically for logs, metrics, or traces.
-
Visualization (The Dashboard): You use a visualization tool (like Grafana) to pull the stored data from the backends and present it in cohesive, readable dashboards.
The three pillars of telemetry data
Instrumentation focuses on collecting three distinct kinds of data, often referred to as "The Three Pillars" of observability:
| Kind of Data | Definition | Common Telemetry Backend |
|---|---|---|
| Logs | Text records of specific events or states happening within the application. | Loki |
| Metrics | Numerical, aggregate data points (e.g., CPU usage, request latency counts, memory consumption). | Prometheus |
| Traces | The complete journey of a single request as it flows through the various parts of your system. | Tempo |
Grafana is the "single pane of glass" that unifies all three data types. It is a web-based visualization platform that connects to multiple telemetry backends simultaneously.
These are the most common choices in the Grafana ecosystem, but they are not the only options. Alternatives include Elasticsearch for logs, InfluxDB for metrics, and Jaeger for traces.
Observability architecture overview
Here's how the moving parts integrate with each other:
The flow works like this:
- Spring Boot apps expose metrics via Micrometer and send traces via OTLP to Tempo
- Promtail scrapes Docker container logs and sends them to Loki
- Prometheus scrapes metrics from each app's
/actuator/prometheusendpoint - Grafana queries all three backends to display unified dashboards
Here's a summary of the new and modified files:
Repository setup
Micrometer Registry Prometheus
Add micrometer-registry-prometheus to expose metrics in Prometheus format at /actuator/prometheus
- Java
- Kotlin
- Groovy
implementation 'io.micrometer:micrometer-registry-prometheus:1.17.0-M2'
implementation("io.micrometer:micrometer-registry-prometheus:1.17.0-M2")
implementation 'io.micrometer:micrometer-registry-prometheus:1.17.0-M2'
Application configuration
Enable the observability endpoints and configure where to send traces.
- Java
- Kotlin
- Groovy
- management.endpoints.web.exposure.include: Exposes health, info, prometheus, and metrics endpoints
- management.tracing.sampling.probability: Set to
1.0to trace 100% of requests (reduce in production) - management.otlp.tracing.endpoint: Sends traces to Tempo via OTLP HTTP protocol
- logging.pattern.level: Embeds trace context (trace_id, span_id, trace_flags) in every log line
Observability setup
Docker Compose configuration
Add the observability stack services to docker-compose.yml:
Each Spring Boot service gets two additions:
depends_on: Ensures Tempo starts before the appsnetworks: Joins themonitoringnetwork so apps can reach Tempo
The observability stack includes:
- Prometheus: Scrapes metrics from all services
- Loki: Stores and indexes log data
- Promtail: Collects Docker container logs and forwards to Loki
- Tempo: Receives and stores distributed traces
- Grafana: Visualizes metrics, logs, and traces in unified dashboards
In some projects, it's common to find observability services living in a
completely separate Docker Compose project, or even managed by third-party
providers like Datadog or Grafana
Cloud. Bundling everything into a single
docker-compose.yml here keeps things simple for documentation and makes the
setup easier to follow.
Loki
Loki is a horizontally-scalable, highly-available, multi-tenant log aggregation system inspired by Prometheus.
Dockerfile:
FROM alpine:latest AS builder
RUN mkdir -p /loki/chunks /loki/rules
FROM grafana/loki:3.5.10
COPY /loki /loki
COPY observability/loki-config.yml /etc/loki/local-config.yaml
USER 10001
Uses a multi-stage build to create directories with correct permissions (Loki runs as user 10001).
Configuration:
- auth_enabled: false: Disables authentication for local development
- storage.filesystem: Uses local filesystem storage (suitable for single-node setups)
- retention_period: Keeps logs for 15 days (360 hours)
- analytics.reporting_enabled: false: Disables anonymous usage reporting
Promtail
Promtail is an agent which ships the contents of local logs to Loki.
Dockerfile:
FROM grafana/promtail:3.5.10
COPY observability/promtail-config.yml /etc/promtail/config.yml
Configuration:
- docker_sd_configs: Discovers Docker containers automatically
- relabel_configs: Filters for only
spring-*services and renames labels - pipeline_stages: Parses log lines to extract the log level and create indexed labels
The regex pattern trace_id=\S+ span_id=\S+ trace_flags=\S+ (?P<type>\w+) \S+ --- extracts the log level from your Spring Boot log format, enabling filtering by log type (INFO, ERROR, DEBUG, etc.) in Grafana.
Tempo
Tempo is a high-volume, minimal-dependency distributed tracing backend.
Dockerfile:
FROM alpine:latest AS builder
RUN mkdir -p /tmp/tempo/blocks /tmp/tempo/wal /tmp/tempo/generator/wal && \
chown -R 10001:10001 /tmp/tempo
FROM grafana/tempo:2.10.0
COPY /tmp/tempo /tmp/tempo
COPY observability/tempo.yml /etc/tempo/tempo.yml
CMD ["-config.file=/etc/tempo/tempo.yml"]
Creates required directories with proper ownership before copying the Tempo binary.
Configuration:
- distributor.receivers.otlp: Accepts traces via OTLP on ports 4317 (gRPC) and 4318 (HTTP)
- storage.trace.backend: local: Uses local filesystem for trace storage
- metrics_generator: Enables service graph and span metrics generation
- usage_report.reporting_enabled: false: Disables telemetry reporting
Prometheus
Prometheus is a systems monitoring and alerting toolkit that collects and stores its metrics as time series data.
Dockerfile:
FROM prom/prometheus:v3.9.1
COPY observability/prometheus.yml /etc/prometheus/prometheus.yml
Configuration:
- scrape_interval: Collects metrics every 60 seconds
- scrape_configs: Defines three jobs to scrape metrics from each Spring Boot service
- metrics_path: Points to
/actuator/prometheuswhere Micrometer exposes metrics
Grafana
Grafana provides visualization and analytics for your observability data.
Dockerfile:
FROM grafana/grafana:11.6.11
COPY observability/grafana/datasources /etc/grafana/provisioning/datasources
COPY observability/grafana/dashboards/dashboards.yml /etc/grafana/provisioning/dashboards/dashboards.yml
COPY observability/grafana/dashboards/*.json /var/lib/grafana/dashboards/
Copies provisioning configuration for datasources and dashboards at build time.
Datasources Configuration:
Configures three datasources:
- Prometheus: For metrics, marked as default
- Loki: For logs, with trace ID extraction for correlation
- Tempo: For traces, with links back to Loki logs
The exemplarTraceIdDestinations and derivedFields configurations enable trace-to-log correlation. When you see a metric spike, you can click to view the trace; when viewing logs, you can click the trace ID to see the full distributed trace.
Dashboards Configuration:
apiVersion: 1

providers:
  - name: 'default'
    orgId: 1
    folder: ''
    type: file
    disableDeletion: false
    updateIntervalSeconds: 10
    allowUiUpdates: false
    options:
      path: /var/lib/grafana/dashboards
      foldersFromFilesStructure: false
Enables automatic dashboard loading from /var/lib/grafana/dashboards.
The repository includes two pre-configured dashboards adapted from the Grafana community:
JVM Micrometer (
dashboard 4701
): JVM metrics including memory, threads, GC, and class loading
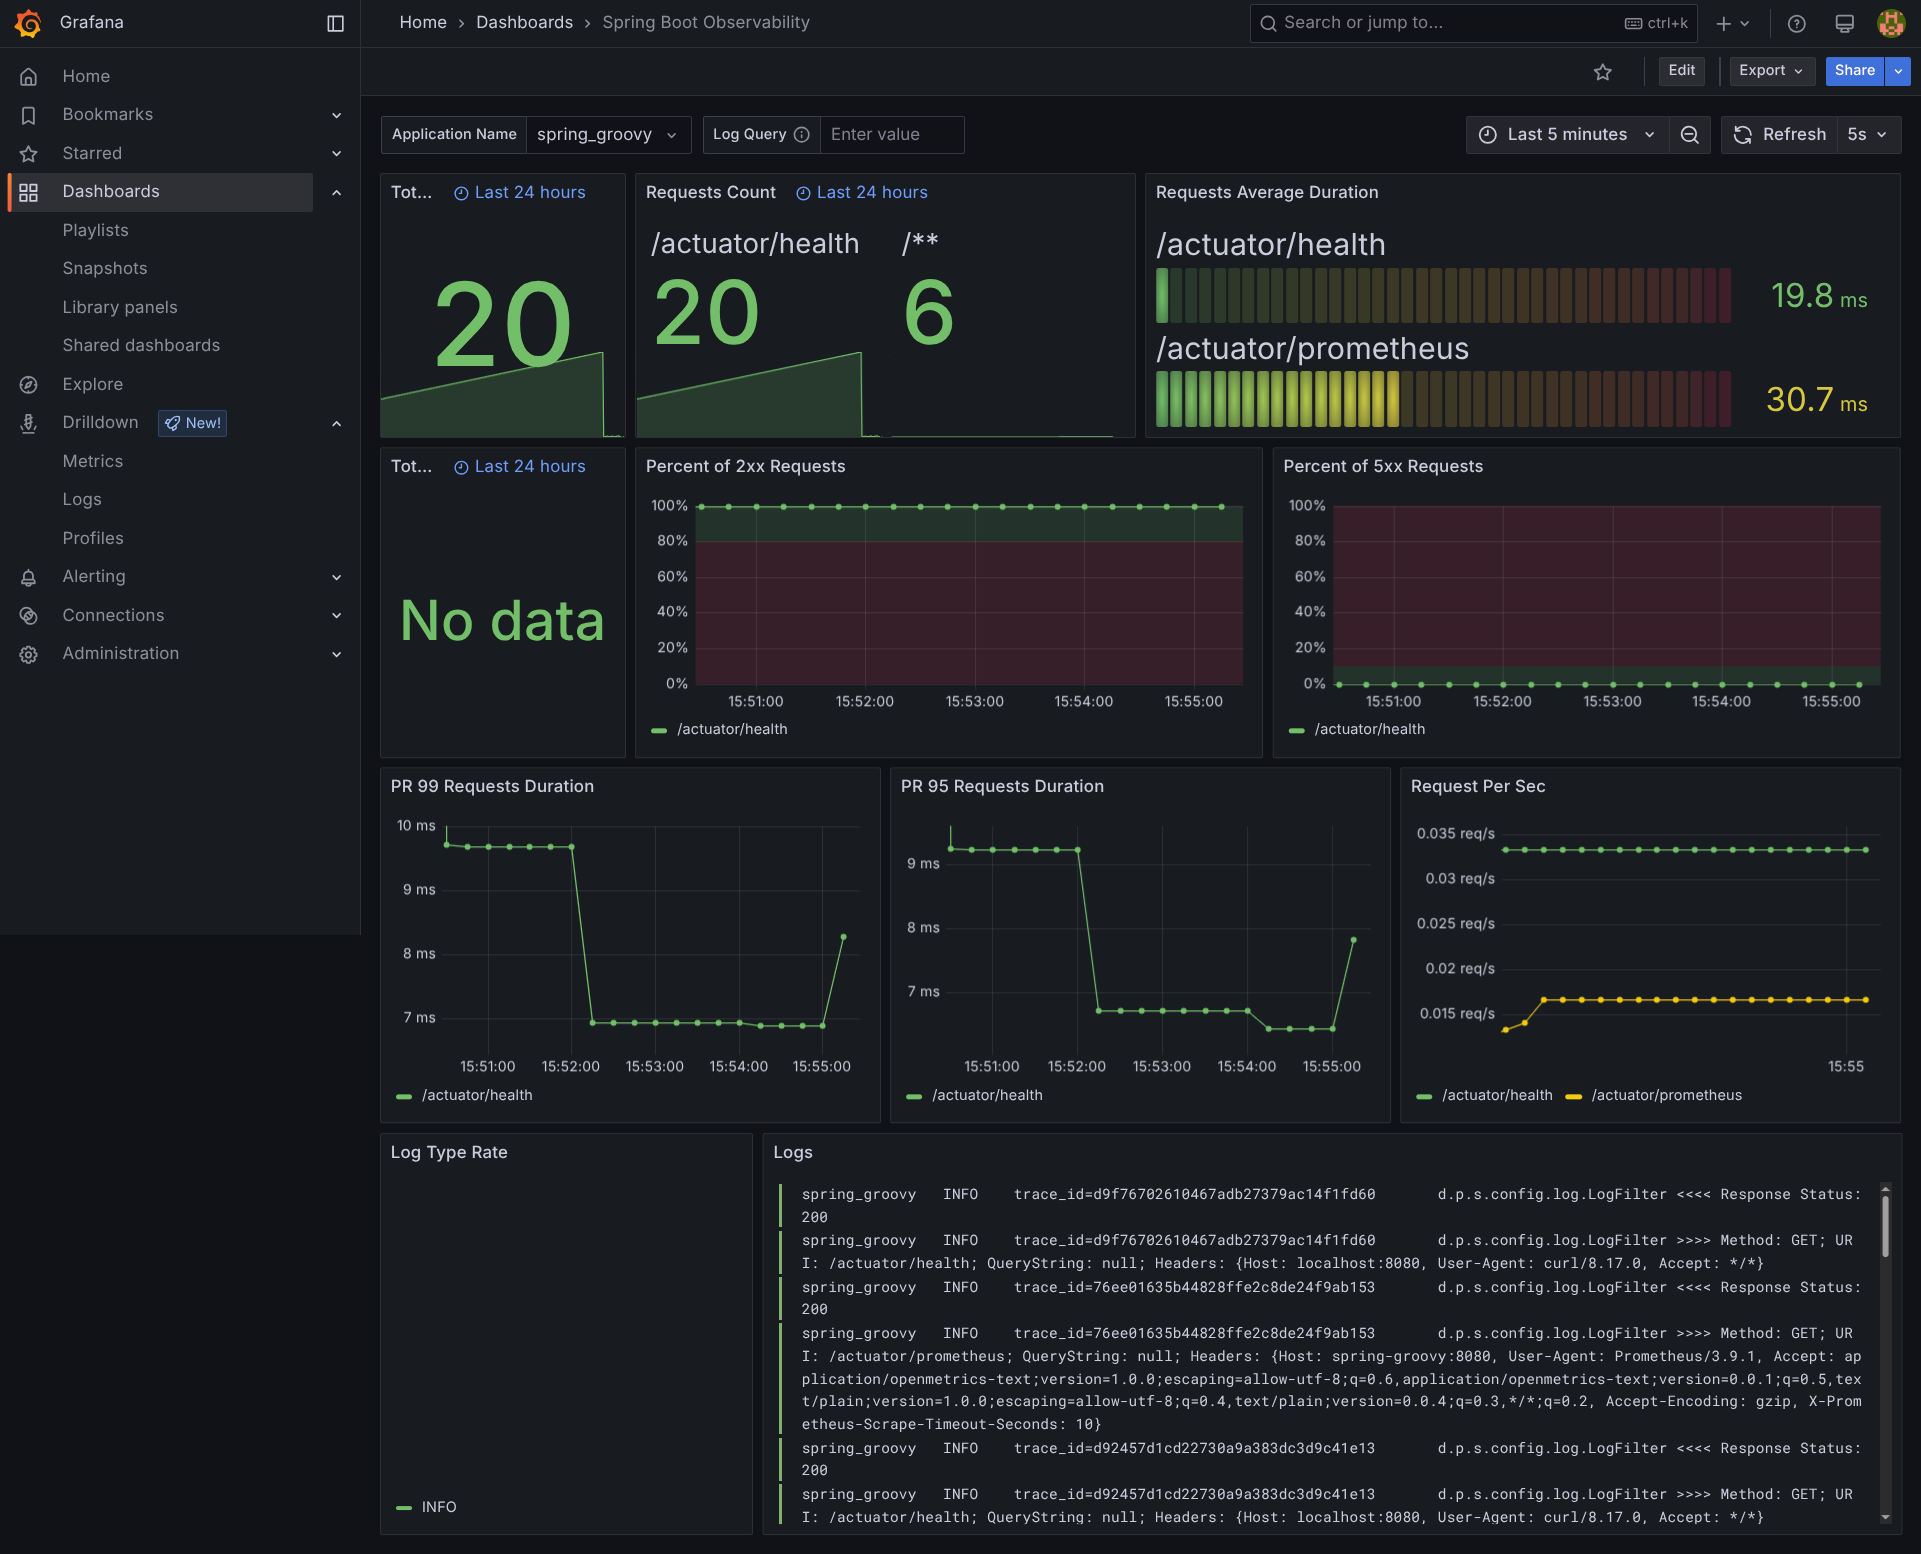
Spring Boot Observability (
dashboard 17175
): Application-level metrics with HTTP request rates, response times, and error rates
These are omitted from the patch due to their size (thousands of lines of
JSON), but you can find them in the repository at
observability/grafana/dashboards/.
Production deployment with Coolify
When deploying to Coolify, the platform automatically detects the new services defined in your docker-compose.yml and starts them alongside your Spring Boot applications. You do not need to manually configure the monitoring stack.
The only additional step is to assign a domain to Grafana so you can access the dashboards:
- In Coolify, find the Grafana service in your project
- Click on it and set a domain (e.g.,
grafana.yourdomain.com) - Coolify will handle SSL certificates and routing
Grafana expects the environment variables GF_SECURITY_ADMIN_USER
and GF_SECURITY_ADMIN_PASSWORD to be set. Make sure to define
them in your Coolify service configuration before starting the stack.
Grafana access
Once logged in, the pre-configured dashboards are available at:
https://grafana-domain-you-have-set-in-coolify/dashboards
You will find:
- JVM Micrometer: JVM internals (memory pools, garbage collection, threads)
- Spring Boot Observability: HTTP metrics, response times, error rates
With the observability stack in place, you now have full visibility into your applications: metrics in Prometheus, traces in Tempo, and logs in Loki, all unified through Grafana dashboards. When something goes wrong in production, you can trace a request end-to-end, jump from a metric spike to the relevant logs, and pinpoint the root cause without guesswork.